The State of Financial Search in 2026: A SERP Landscape Analysis
What You Will Learn in This Financial Search Report
The largest wealth transfer in history is underway. Over the next decade, an estimated $84 trillion in private wealth will change hands, and the advisors who capture it are being found through search. Among investors under 45, 87% research a financial advisor online before they ever make contact. The first impression of your firm now forms on a search results page, before a prospect fills out a form or picks up the phone.
This report maps what that results page looks like in 2026 and where the open positions sit. We analyzed more than 2,400 financial queries and scored over 500 advisory firm sites against the POINT Financial SERP Visibility Index, our five-dimension framework for predicting search performance. Aggregator platforms own most of the visible real estate, and the highest-converting positions, local and brand searches, stay within reach for firms that build the right search infrastructure.
Search behavior is shifting again as AI Overviews reshape how visibility gets earned. Our companion AI Visibility Gap study found that 89% of the sources AI platforms cite point to third-party media, and financial queries draw especially cautious AI behavior because of their YMYL sensitivity. This report shows which query types trigger AI Overviews, where those answers pull their citations, and how the click-through impact varies from informational searches to local and branded ones.
Inside, you will find the full POINT framework, the aggregator share-of-SERP map, the AIO behavior map by query type, and the local search data that points to the highest-ROI channel available to advisory firms today. The report closes with a five-point action plan your team can run this quarter: benchmark your POINT score, claim your local presence, build E-E-A-T advisor profiles, develop an AIO-ready content library, and connect organic search to qualified referrals and AUM growth.
Report highlights

The 2026 Buying Reality
The economics of financial search have shifted. $84 trillion in wealth is moving to a generation that begins every advisor search online, and 87% of investors under 45 research a firm before first contact. This section breaks down what the great wealth transfer means for advisory demand and why the search results page has become your firm's first impression.

The POINT Visibility Framework
A repeatable way to measure where you stand. The POINT Financial SERP Visibility Score grades a firm across five dimensions that predict search performance: Presence, Optimization, Intent, Named Authority, and Trust. The report shows how we scored 500+ advisory sites and how your firm can benchmark itself against the same index.

Who Owns the Financial SERP
We mapped every top position across 2,400+ financial queries. Aggregators hold 58% of them, and five platforms control 81% of the top-three spots. This section shows where individual advisory firms compete today and identifies the query types where a focused firm can win visibility without competing head-on against platforms that publish thousands of articles a month.

The AI Overview Behavior Map
AI Overviews now appear on the majority of informational financial queries, and they change the value of each ranking. The report maps AIO coverage, top citation source, and click-through impact across five query types, from “what is a fiduciary” to “financial advisor near me,” so you can see which searches still send clicks to your site and which ones reward a different play.

The Local Search Opportunity
Local search is the highest-ROI digital channel for advisory firms. Local intent traffic drives 4.2X more qualified leads and 3.2X more contact form submissions than brand search, and 89% of advisor searches carry a local modifier. This section quantifies the opportunity and shows the specific local assets, map pack presence, city and service pages, and a complete Google Business Profile, that turn local intent into booked consultations.

What Leading Firms Do Differently
The report distills the patterns behind the firms winning the financial SERP: they own their local presence, build E-E-A-T around named advisors, optimize content for AI citations, and connect marketing to revenue with attribution that tracks organic search through to AUM growth. Real DAP results back each pattern, including ConnexPay, Kyros, Cove Markets, and Secure Illinois Retirements.

Your 5-Point Action Plan
The report closes with a plan you can execute this quarter. Benchmark your POINT score, claim your local presence, build E-E-A-T advisor profiles, develop an AIO content library, and implement revenue attribution. Each step maps to a finding in the data so your team knows why it matters and where to start.
Peek Inside the Guide
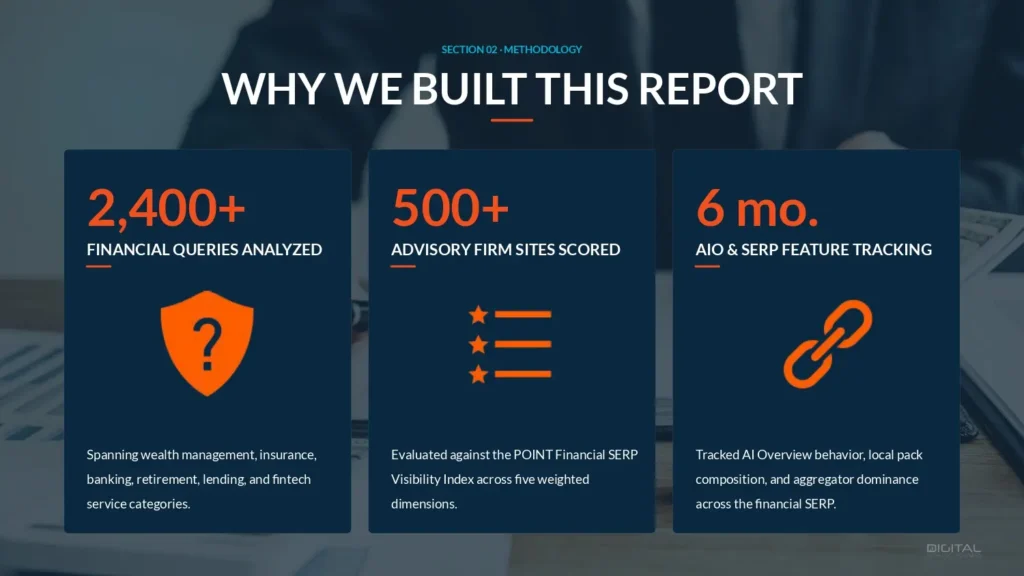
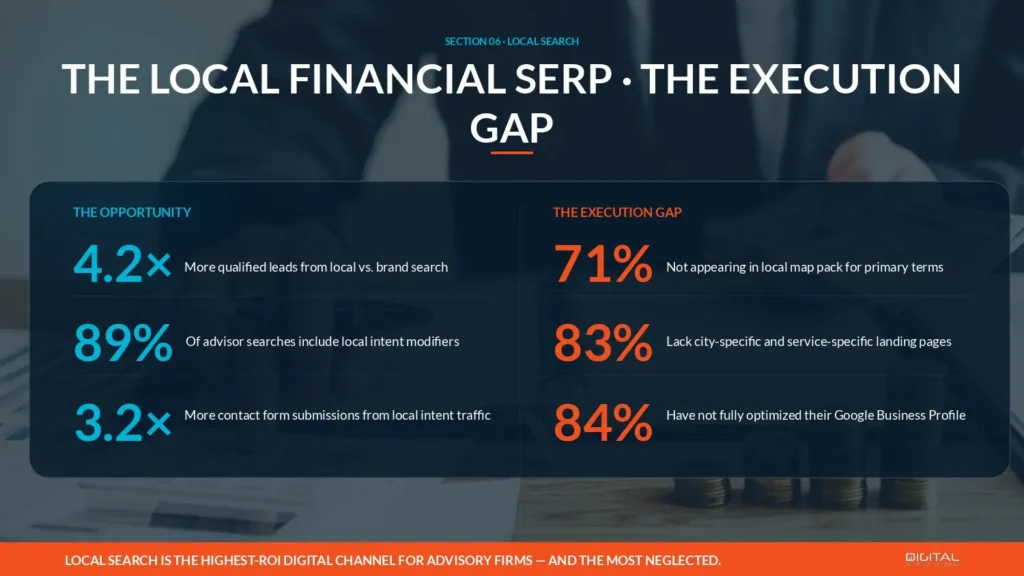
Table of contents
The $84 Trillion Great Wealth Transfer
Why the Next Generation Starts With Search
How AI Is Restructuring Search Visibility
2,400+ Financial Queries Analyzed
500+ Advisory Firm Sites Scored
Six Months of AIO and SERP Feature Tracking
Presence, Optimization, and Intent
Named Authority and Trust
How the Five Dimensions Predict Performance
The Domain Type Mix Across Top Positions
Where Individual Advisory Firms Stand at 7%
The Content Output Gap
The Five Platforms Controlling 81% of Top-3 Positions
Why Head-On Competition Falls Short
The Opening Focused Firms Can Claim
AIO Coverage by Query Type
Where AI Overviews Pull Their Citations
The Click-Through Impact by Search Intent
The Local Search Opportunity: 4.2X Qualified Leads
The Execution Gap Most Firms Leave Open
Why Local Is the Highest-ROI Channel
The POINT Index Score Distribution
Organic CTR Benchmarks and Top-Performer Lift
AIO Readiness Across Advisory Sites
Own the Local Presence
Build E-E-A-T Around Named Advisors
Optimize for AI Citations and Revenue Attribution
Compliance-Aware Content Production
YMYL Quality Standards
Revenue Attribution in Long Sales Cycles
DAP Results in Financial Services and Fintech
The Five-Point Action Plan
Benchmark Your POINT Score
Similar white papers

Google treats financial queries differently from every other vertical. The same system that writes confident overviews for recipes and travel applies stricter safety filters to...

The Department of Justice moved the first Title II compliance date to 26 April 2027, which leaves eight months for public entities serving 50,000 people...
Most software evaluations finish somewhere a vendor does not control. 6sense measured 94% of buying groups ranking their vendors before speaking to a seller, with...
Have questions about this white paper?
Let’s talk!