ChildrenChic
ChildrenChic sold premium children’s footwear on Shopify, and Digital Authority Partners managed its Google Ads and Meta Ads from January to October 2025. The problem was not the advertising. Shopify and Google Analytics disagreed about revenue by $122,539 over 90 days, and Google Ads claimed $75,125 that belonged to other channels. Paid social sent 57% of the site’s traffic and lost it after nine seconds. DAP rebuilt the measurement layer before touching a campaign, then split Google Ads by product line and turned Meta into a three-stage funnel. Purchases on Meta then rose 43% on a flat budget, total paid media spend came down 4%, and the account returned 9.57x on its best day.


ChildrenChic was a direct-to-consumer children’s footwear brand founded in 2014, built around the Spanish-style Mary Jane. The range later widened into loafers, boots, sneakers and sandals for infants through youth sizes. Every pair was handmade by family-run workshops in Alicante, Spain and Felgueiras, Portugal. Each was designed for daily wear with flexible rubber soles, Velcro closures and machine-washable construction. The brand sold on Shopify to customers in the United States and more than 25 other markets.
How We Helped Children Chic, Inc.


Project Summary
DAP started with the numbers rather than the ads, because none of them agreed. Shopify and Google Analytics each reported a different revenue figure, and Google Ads took credit for sales that Google Analytics assigned elsewhere. So we named Shopify the source of truth, moved event tracking into Google Tag Manager, and built one dashboard both teams could work from. Only then did we rebuild the accounts. Google Ads was split into a campaign per product line under Target ROAS bidding, and Meta became a three-stage funnel that built its own retargeting pools. By the second quarter Meta purchases had risen 43% on a flat budget, and the account returned 9.57x on its best single day.
The Challenge
 Conflicting Revenue Data
 Two Systems, a $122,539 Gap
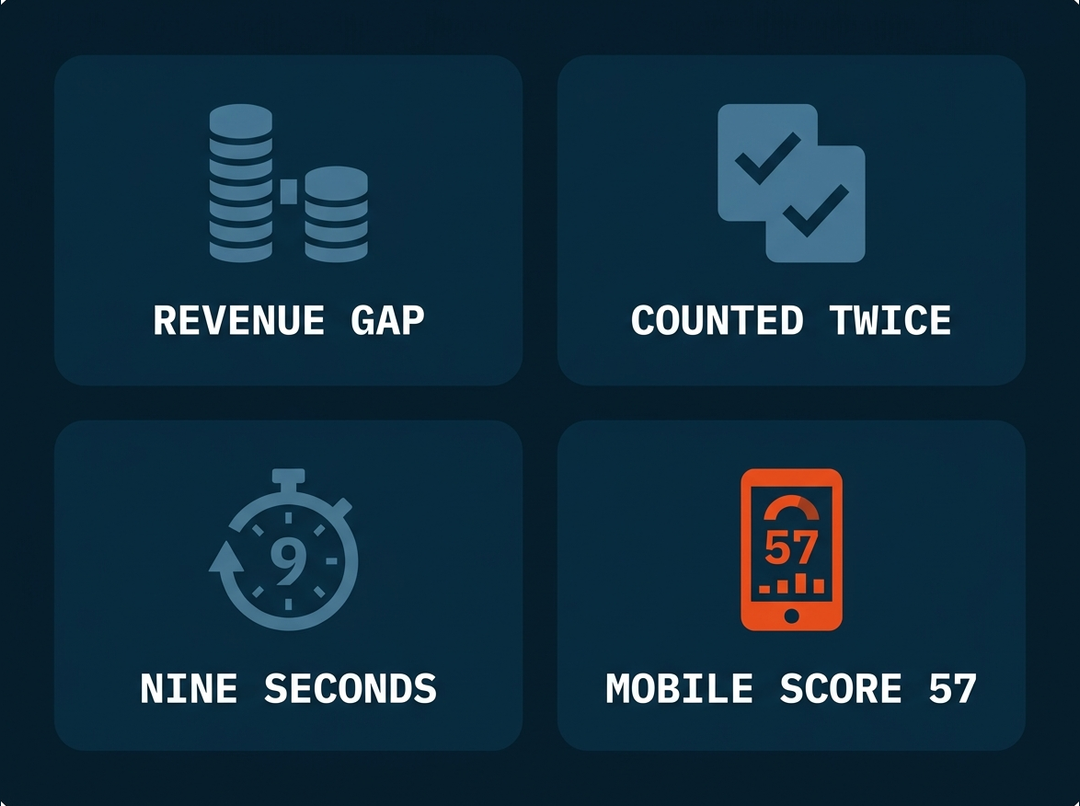
Over the 90 days to January 30, 2025, Shopify recorded $301,003.93 in net sales and Google Analytics recorded $178,464.88. The gap was a tagging problem. Ecommerce events fired through gtag.js rather than Google Tag Manager, so what reached Google Analytics arrived stripped of product detail and was discarded after two months. With the two systems disagreeing on what a month of revenue was, every return on ad spend figure was open to argument.
 Double-Counted Ad Revenue
 $75,125 in Google Ads Against $40,622 in Analytics
Across the same 90 days Google Ads reported $75,125 of revenue on 529 transactions while Google Analytics reported $40,622 on 678. Google Ads ran last-click attribution and claimed purchases that Google Analytics had spread across paid and organic search. A Shopping Revenue event in the same account counted a share of them twice. Every bid decision rested on a figure that was too high.
 Paid Social Without a Funnel
 57% of Traffic, Nine Seconds of Attention
Paid social was the biggest source of traffic and the worst at holding it, sending 57% of sessions and keeping the average visitor for nine seconds. Direct traffic held people for 27 seconds and search held them past a minute, against a 52-second benchmark. All that volume produced $42,160, or 23% of revenue. The problem was structural, since the campaigns bought clicks from strangers and asked them to buy on the first visit.
 Mobile Carried the Traffic and the Worst Experience
 75% of Sessions, 21 Seconds of Engagement
Three quarters of the store’s traffic arrived on a phone, and the phone was where the experience was weakest. Mobile carried 66,107 sessions and $134,851.83 of revenue but held visitors 21 seconds against 33 on desktop. A performance audit scored the site 57 out of 100, with load speed the worst measure, and checkout drop-off concentrated on the shipping details step. Slow pages also raised the price of every Google Ads click through Quality Score, so one problem cost the brand twice.
How we Helped Children Chic, Inc.
One Source of Truth for Revenue
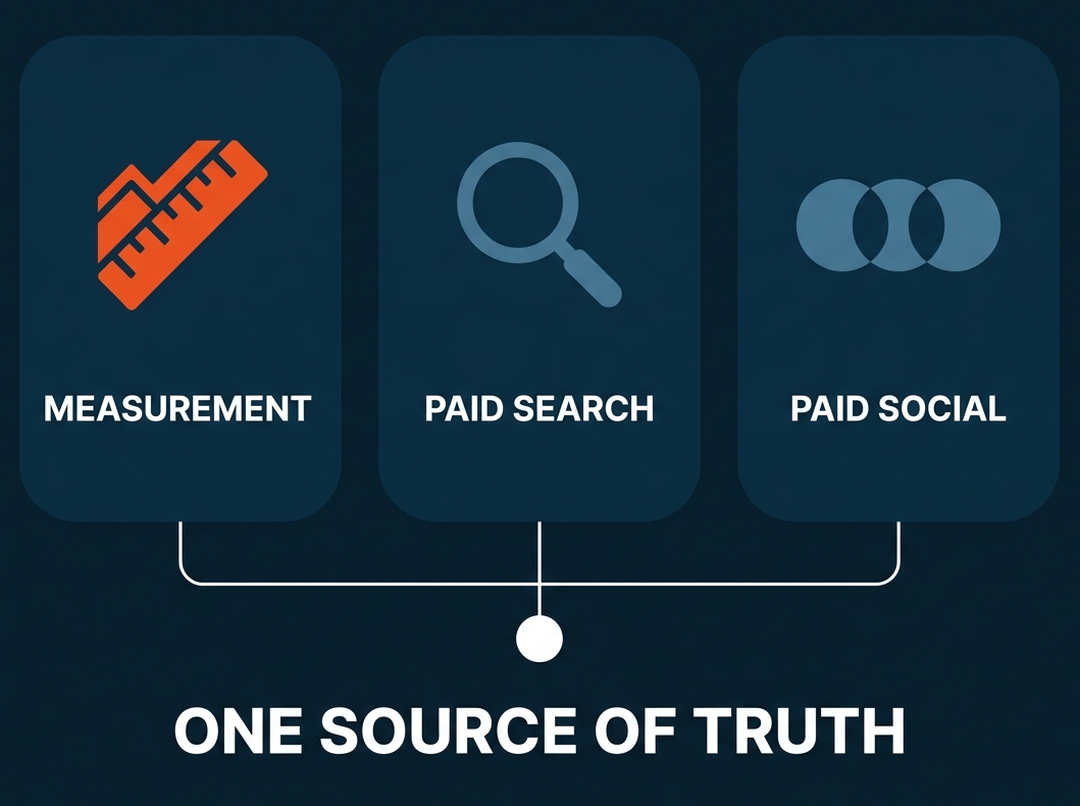
DAP fixed the reporting first, because tuning bids toward a disputed number is wasted work. Shopify became the source of truth, on net sales after discounts and returns.
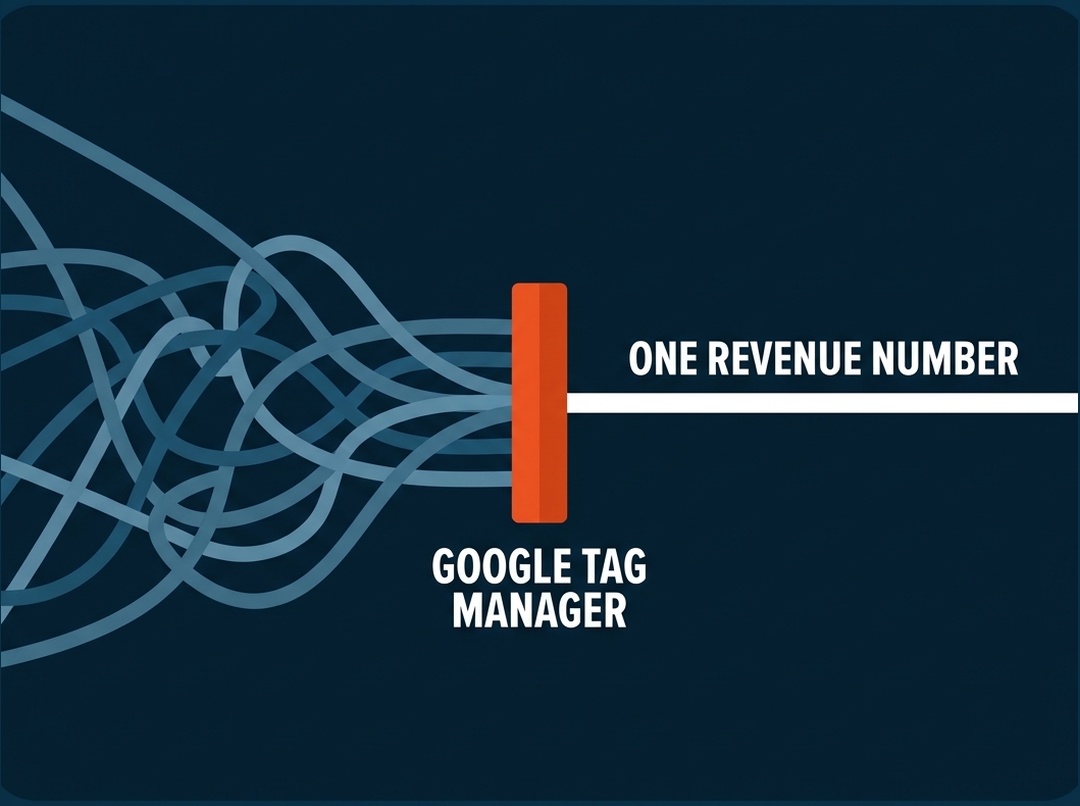
- Event tracking moved from gtag.js to Google Tag Manager, so every add to cart carried product ID, name, quantity and price
- Google Analytics purchase events made primary in Google Ads, and the Shopping Revenue event deleted to end the double count
- Google Analytics retention raised from two months to 14, so year-on-year comparison became possible
- Internal IP addresses excluded, so staff testing stopped counting as real add to cart activity
- Microsoft Clarity recordings on checkout, with revenue tracked per step so the money lost at the shipping screen could be counted
Google Ads Rebuilt Around Product Lines
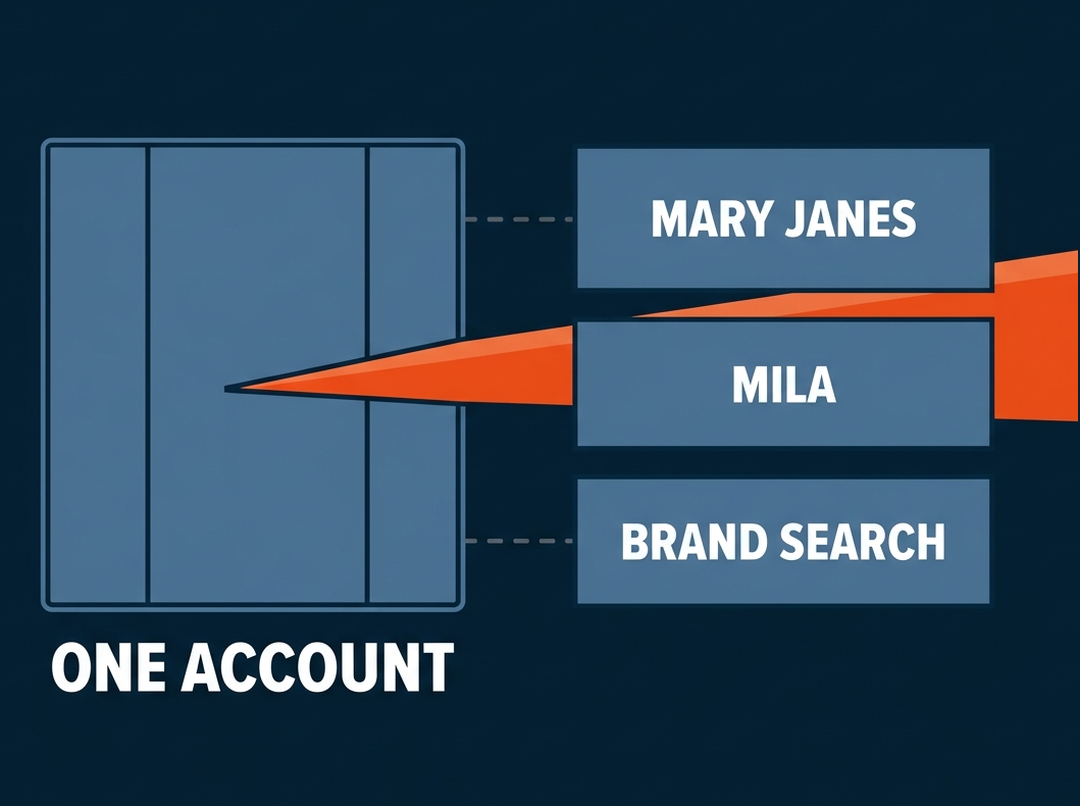
Every product had been competing for the same budget inside one branded campaign and one legacy shopping campaign. DAP split the account by product line and let Target ROAS bidding work each one.
- Keyword research, ad copy and negative keyword lists rebuilt, with feed specs written for ChildrenChic’s developers to apply
- Separate Performance Max campaigns for Mary Janes and Mila, with the legacy Alpha shopping campaign held at low budget as a control
- Mary Janes search cut to women aged 35 to 44 in the top 10% income bracket, with every other bracket and all unknowns excluded
- Target ROAS raised every three days once a campaign hit its daily budget, guided by location and day-of-week analysis
- Demand Gen and YouTube campaigns added for cart abandoners, past purchasers and cold prospecting
A Full Funnel on Meta
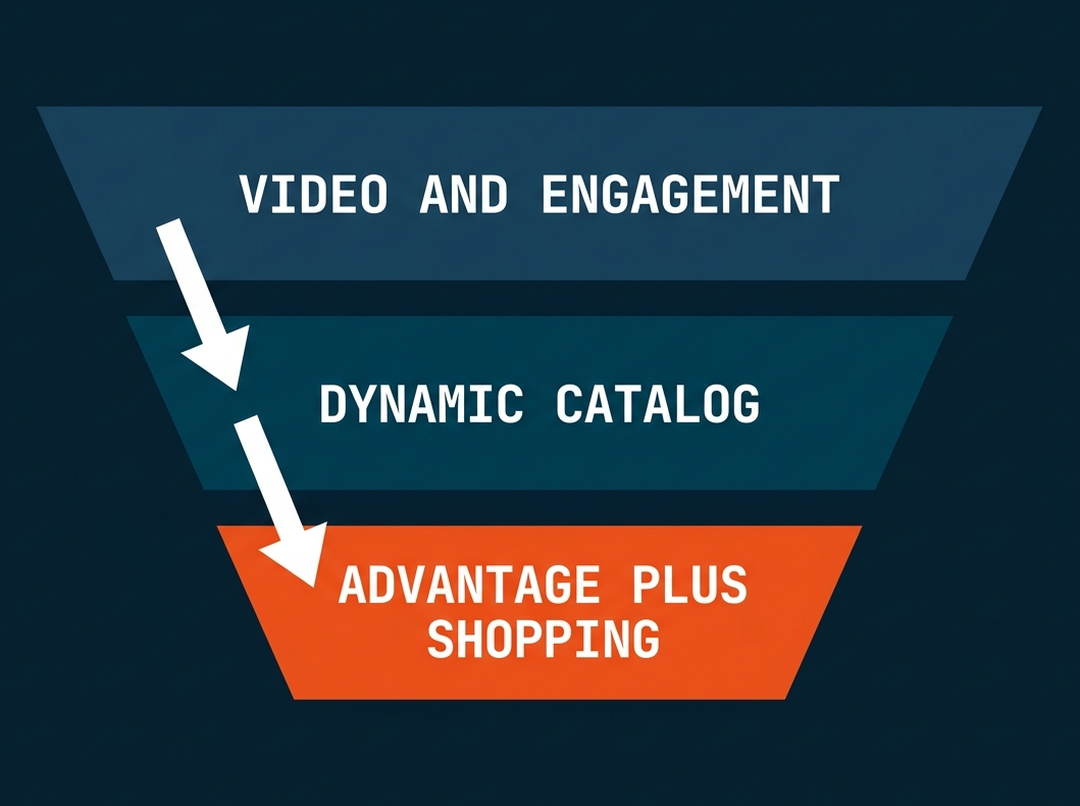
Meta had been running interest campaigns that asked cold traffic to buy outright. DAP replaced them with three stages, each one built to feed the next.
- Video view and engagement campaigns at the top, building the pools the lower stages would retarget
- A dynamic catalog and Dynamic Ads for Broad Audiences in the middle, putting product in front of those pools
- Advantage+ Shopping at the bottom, closing the shoppers the two stages above it had produced
- Retargeting built from video viewers and Instagram engagers, plus a one percent lookalike stack off purchase data
- Separate Advantage+ campaigns for California, New York, Texas and Washington
Creative Tested on a Two-Week Cycle
ChildrenChic supplied the assets and DAP supplied the test schedule, reading results every two weeks so that underperforming creative came down rather than quietly running on.
- Formats tested head to head, from flatlay photography with testimonials to animated GIFs with reviews sliding up and publication logos as social proof
- A user-generated content brief delivered in May 2025, so ChildrenChic could feed the top of the funnel without waiting on DAP
- A shared planner marking which ads were live, updated weekly, with Friday creative check-ins
- Each product line in its own campaign, so fatigue on one could not hide a lift on another

A Dashboard Both Teams Read
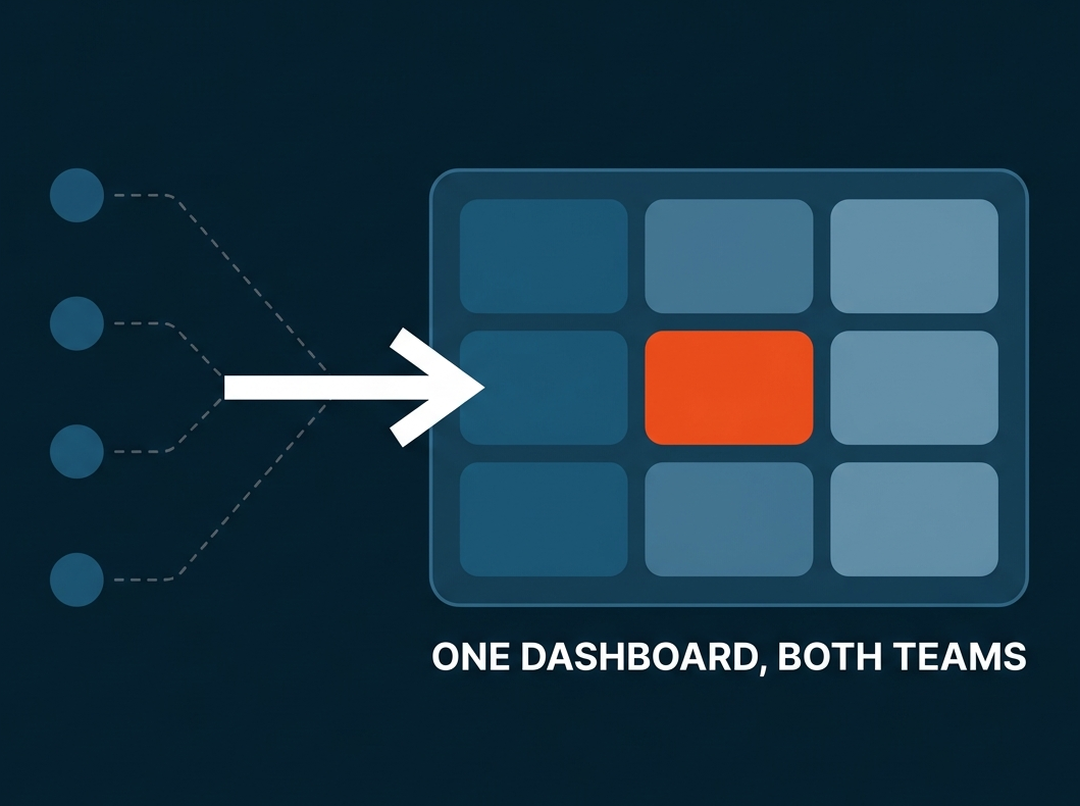
Platform screenshots let each channel report its own best number. DAP replaced them with one dashboard, built over four rounds of client review.
- One Looker Studio dashboard fed by Shopify, Google Ads, Meta Ads and Google Analytics
- Matching tabs per platform plus a blended view, so no channel could be judged on its own numbers
- A funnel tab filterable across nine mediums, from paid search to email, SMS and affiliate
- Product performance by dollars and by units, sorted by demand
- Bi-weekly reviews run on the dashboard rather than on platform exports
What we Achieved

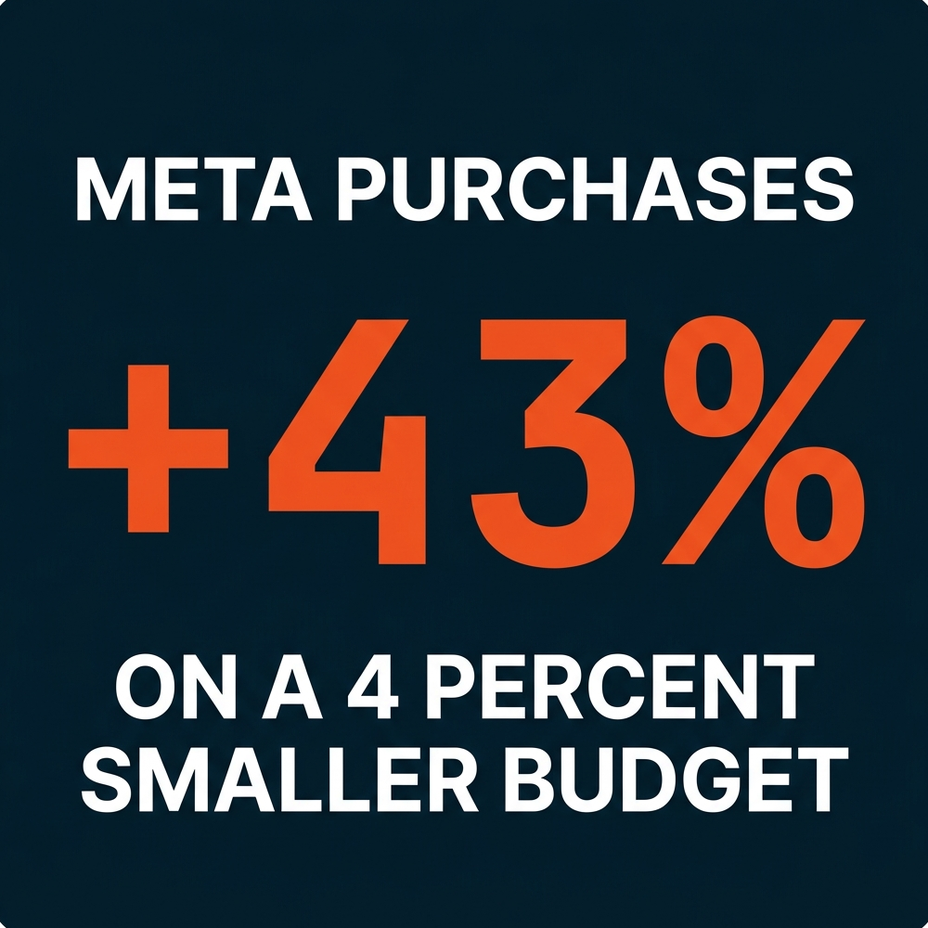
Meta purchases rose from 238 in the first quarter of management, February to April 2025, to 340 in the second, covering May to July. The Meta budget held flat across both quarters, and total paid media spend actually came down 4% over the same period, from $48,615 to $46,688. The extra volume came out of the structure rather than out of the money.

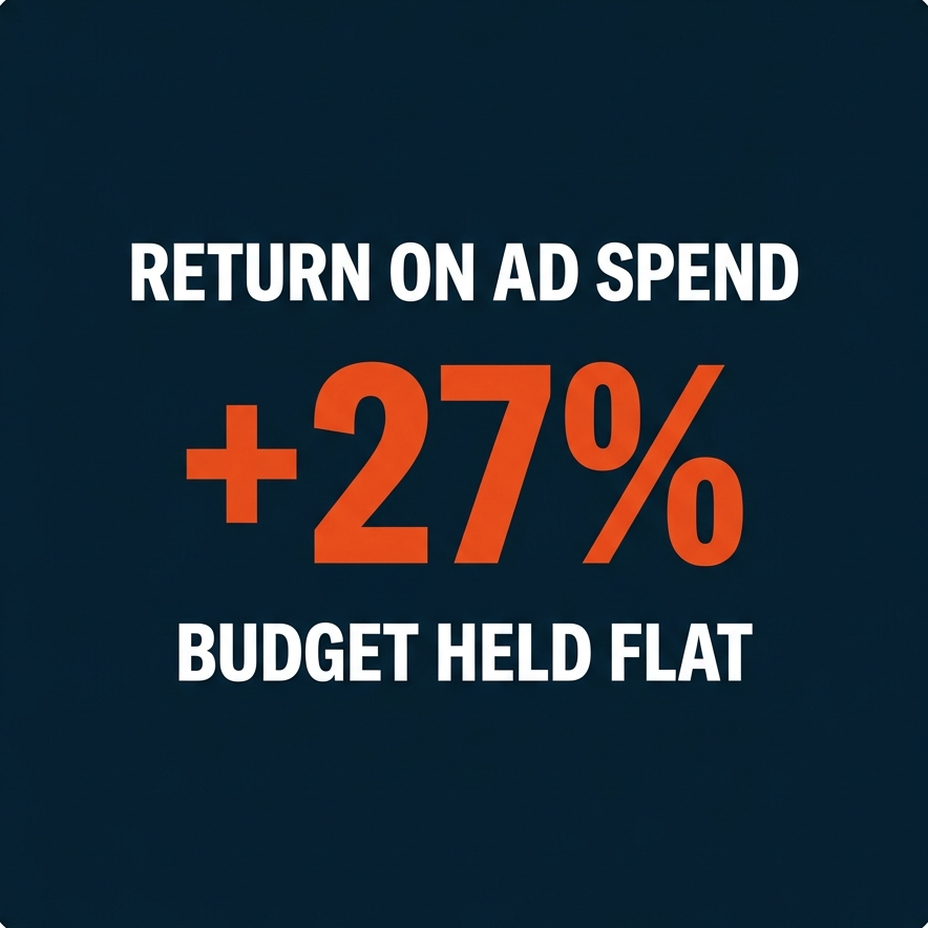
Return on ad spend across the Meta account rose 27% between the two quarters, and conversion rate on the channel rose 197.5%. Because the budget held flat throughout, the gain traces to how the campaigns were built rather than to how much was spent behind them.

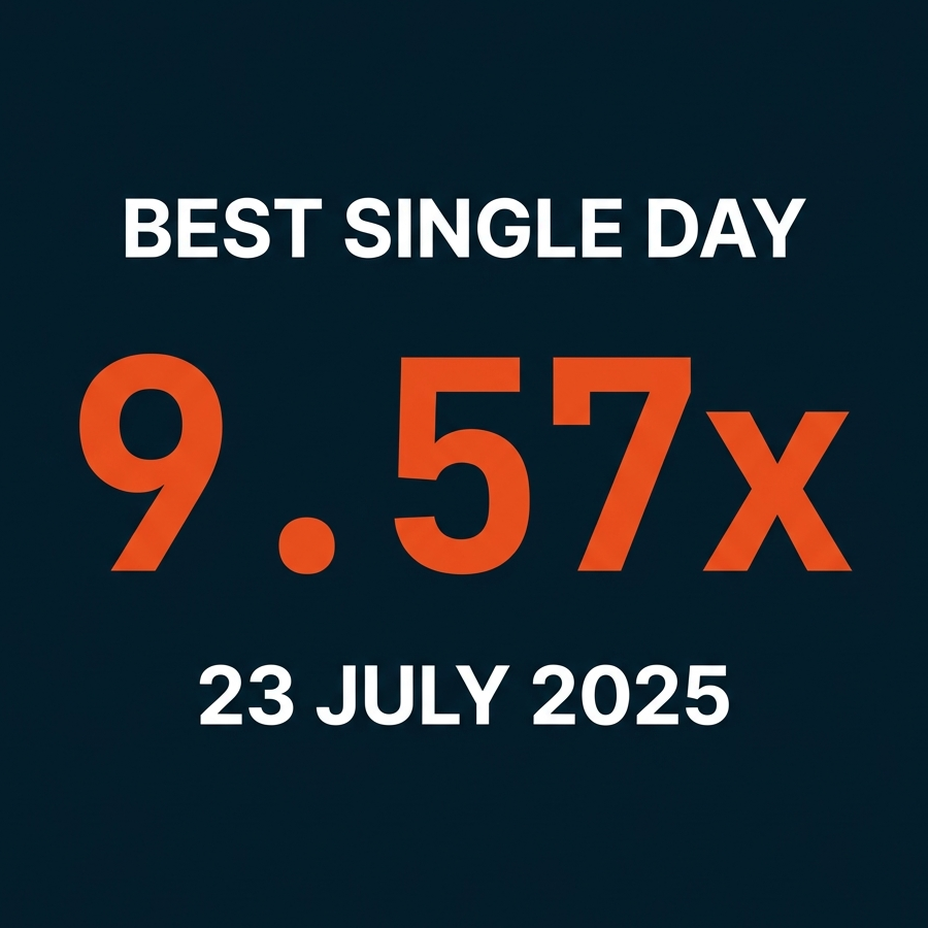
On July 23, 2025 the Meta account returned 9.57x its spend for the day, the highest single-day figure of the engagement. The Fourth of July sale creative behind it also drew 38% more engagement than the account average. That is the kind of day a dated offer produces once the funnel above it is already warm.

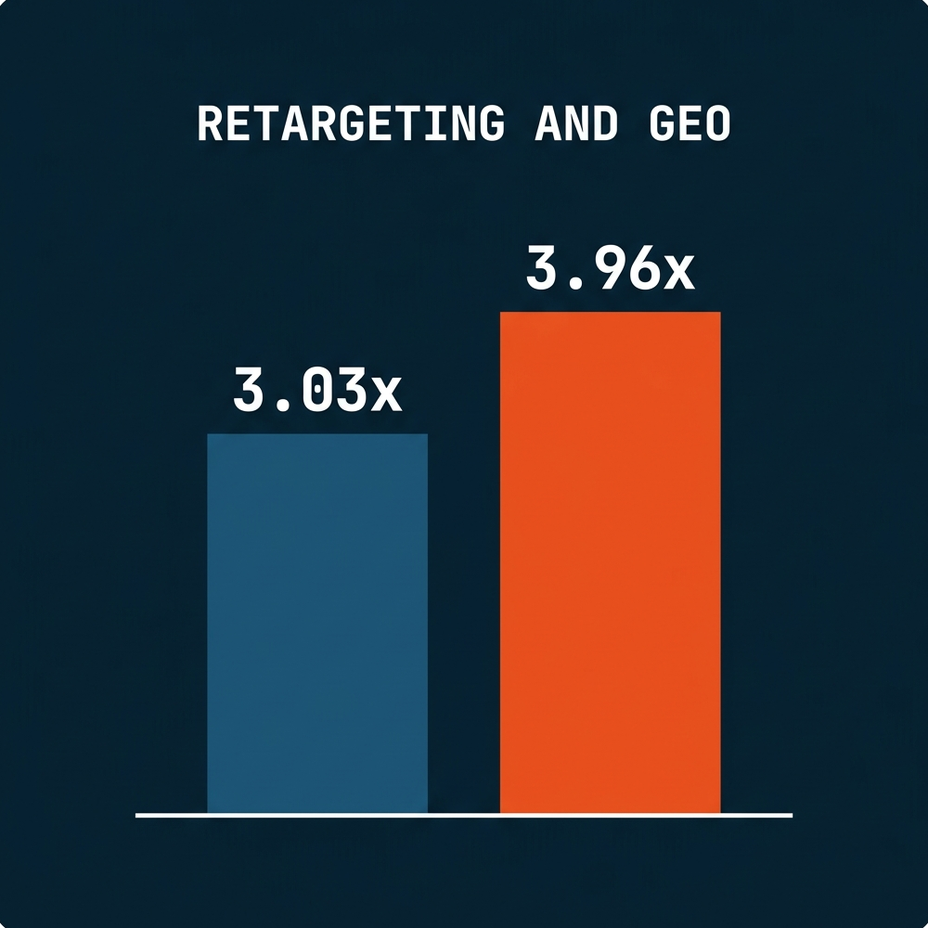
In the reporting period to July 25, 2025 the United States dynamic catalog retargeting campaign returned 3.03x its spend and drew 52 items added to cart. The four-state Advantage+ campaign returned 3.96x from 51. Neither could have run in the old structure, because both drew on audience pools that the awareness campaigns above them had already built.

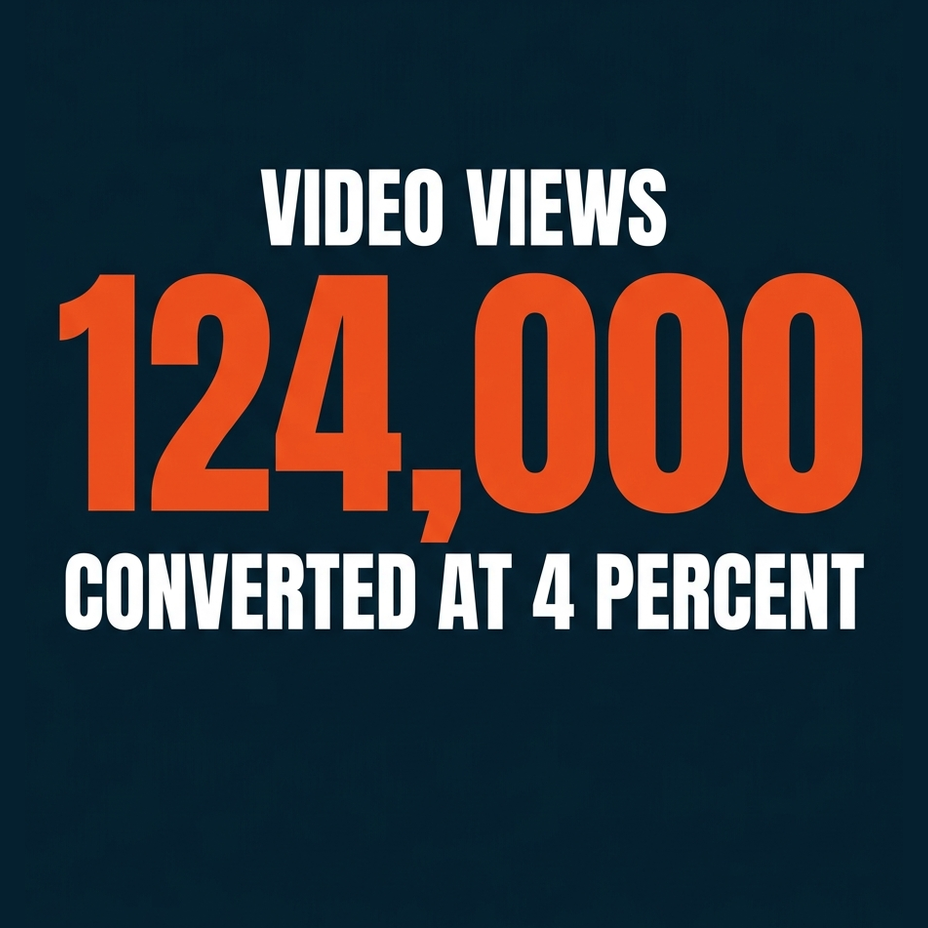
The best-performing video reached 124,000 views by August 8, 2025, making it the most-watched asset of the engagement. It held a 1.58% click-through rate and converted at 4.0%, and the people who watched it became the retargeting pool that the bottom-funnel campaigns drew on. A second reel sat behind it at 82,800 views.