The AI-Ready Intake Benchmark: An Original Study of 149 ABA Clinic Websites
What You’ll Learn in This ABA Intake Study
Families searching for ABA therapy can almost always find a way to make contact, and can usually work out whether their insurance is likely to be accepted. The one thing they cannot get is a fast answer.
Digital Authority Partners audited 149 US ABA and autism therapy clinic websites against six intake signals any family can observe without picking up the phone. Nine percent state how fast they will reply. Fifteen percent let a family book a real appointment slot. Seventeen percent have structured their intake questions so an AI assistant can quote them. Average readiness across the sample is 2.71 of six, and no clinic in the sample passed all six signals.
The sample is 149 clinic operators drawn from a registered pool of 300, stratified by operator size, covering 48 states and all four Census regions. Every scored signal is observable on the public site, every scoring rule was written down before collection, and a second detector built on deliberately different logic was run across every clinic in the sample. No clinic was contacted, and no client or patient data was used. This study sits alongside our AI Visibility Gap research, which measured how AI engines choose and hold citations across 1,127 URLs and five engines.
For an independent clinic, that distribution is the opening. Stated response times and real booking sit near the floor at every operator size, so a single-location clinic competes for both on level terms with a national chain. Three of the six are a decision rather than a budget line. Inside the full report you get the signal-by-signal benchmark, the readiness gradient by operator size, a lifetime-value estimate built from published fee schedules, and five moves ordered by effort.
Correction, August 13, 2026
One clinic left the sample after publication. Mountaineer Autism Project is an advocacy and information body, which the study’s eligibility rule places outside the frame, alongside a comparable organisation already in the exclusion log. The sample now stands at 149 clinics.
Three figures move with it: total passes from 405 to 404, average readiness from 2.70 to 2.71 out of six, and the independent segment from 56 clinics at 2.27 to 55 at 2.29. Within that column, insurance clarity reads 58 percent, machine-readable intake 51 percent and appointment request 35 percent.
The Not assessed rule now applies across every signal. A signal scores Fail only where the page it lives on was retrieved. The study applied that to the inquiry form, giving it a base of 146, and it now covers the response-time promise and Tier 1 booking as well. The assessed base for the response-time promise is an estimated 141, and the pass rate holds at 9 percent on every base: 13 of 150 is 8.7 percent, 13 of 146 is 8.9, and 13 of 141 is 9.2.
The reproducibility line in the method now describes what the delivered files hold. The evidence log carries a verbatim quote or a vendor signature with a source URL for every pass on the response-time promise and instant contact. The per-clinic page URL list and the raw captures sat in the collection session, and 52 of those URLs across 38 domains are retained alongside the dataset.
The frame rule reads correctly as a designed cap of 15 percent of the sample per state. Eight clinics in a single state is the achieved maximum.
Codebook v2.3 carries all of this.
Study Highlights

The Scheduling Illusion: 41% Look Bookable and 15% Are
Thirty-eight clinics offer an appointment-request form behind a button that reads like booking. Scored as a single signal, scheduling comes in at 41 percent. Scored as true booking, where a family sees availability and selects a time, it comes in at 15 percent. Our own 40-clinic pilot read the wider figure as booking, which is why both tiers are scored and published separately here. The test for your own site is whether a parent can leave with a time on their calendar.

The Response-Time Gap: 9% Say How Fast They Reply
Thirteen clinics state a bounded timeframe for answering a family inquiry, and the bar was deliberately low, since any unit of time counted. “Within one business day” passed. “As little time as possible” and “immediate access to care” did not, because a parent comparing three clinics cannot use them to choose. This is the cheapest signal on the list to add and the rarest to find, since it takes no software, no integration and no vendor.

The Quotable Minority: 17% Are Structured for AI Assistants
Sixty-seven percent of the sample carries valid structured data, and much of it arrives by default from a website builder or an SEO plugin. Question markup, the structured question-and-answer data that lets an engine lift an answer directly and attribute it, sits at 17 percent. Those 26 clinics carry 430 valid question-and-answer pairs between them, so the clinics that have done it have done it properly. For a field where families increasingly arrive through an assistant, this is the signal with the most room and the least competition.

Scale Buys Clearer Information, and the Speed Signals Stay Open
Insurance clarity runs from 58 percent among independent clinics to 100 percent among national operators, and machine-readable intake runs from 51 to 79 percent. Every point of that gradient comes from insurance clarity, structured data and instant contact. Stated response times sit between 7 and 12 percent at every operator size, and on true booking the national operators sit behind the independents, so an independent clinic can close the speed gap on its own timetable.
Nobody Passed All Six, and the Average Is 2.70
Seven clinics passed five signals, twenty-five passed one or none, and zero passed all six. A clinic that states a response time, names the plans it accepts, and adds question markup to its intake FAQ moves above the sample average inside a week at close to no cost. The report sets out all five moves in order of effort, with a six-question checklist for scoring your own site in twenty minutes.
Peek Inside the Guide
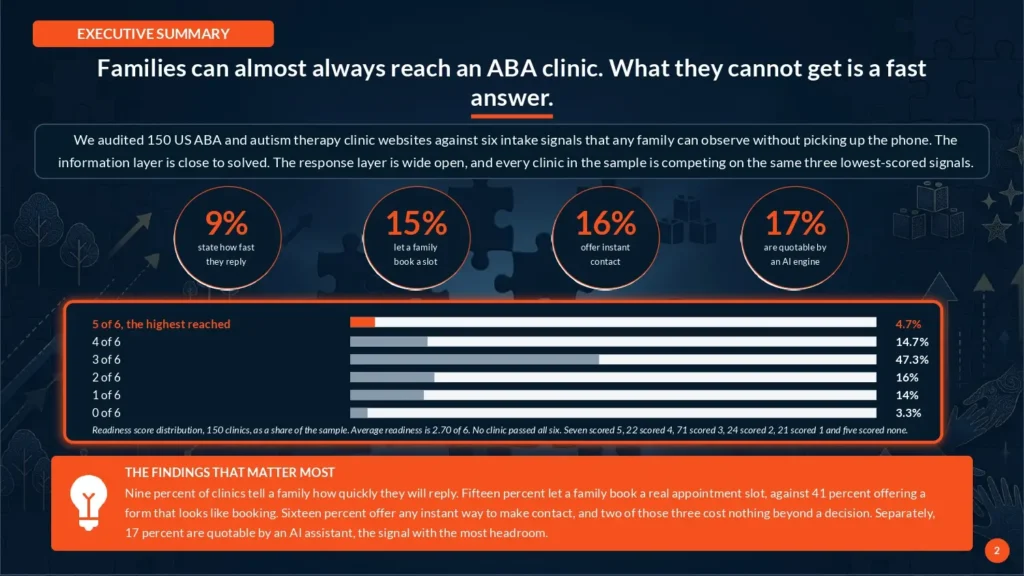
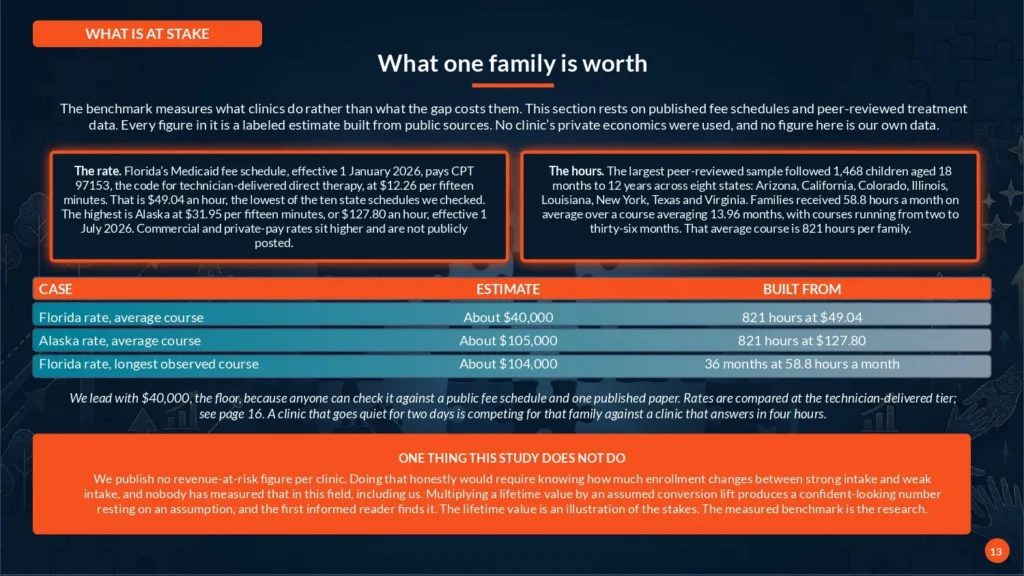
Table of contents
The six intake signals, each observable on a public clinic website and verifiable by anyone who visits the same page.
How the sample was drawn: a registered pool of 300, a fixed random seed, 48 states, and a designed cap of 15 percent of the sample per state, with eight the achieved maximum.
Why the scoring rules were written down before collection, and how a second independent detector was used to check them.
The full pass-rate table across all six signals, from inquiry forms at 92 percent to stated response times at 9 percent.
The two signals that describe the field, and the four where a clinic can still take ground.
The readiness distribution across 149 clinics, and where the sample average of 2.71 sits inside it.
The scheduling illusion in full: the 38-clinic gap between looking bookable and being bookable, with the parent test.
The response-time promise: what passed, what did not, and why a hedge like “we typically respond within 24 hours” still counts.
Instant capture broken out by surface, covering live-agent chat, chatbots and text-to-connect widgets.
The composite signal explained: entity markup, question markup and crawlable intake copy, and why passing takes two of the three.
The platform split that shows how much of the 67 percent arrived by default from a builder or an SEO plugin.
Why question markup is the signal a clinic has to choose, and what the 26 clinics that chose it have built.
The full segment table across independent, regional and national operators, on verified bases.
A lifetime-value estimate built from published state Medicaid fee schedules and the peer-reviewed intensity and duration literature.
Five moves ordered by effort, a six-question self-scoring checklist, and the full method and source list.
Similar white papers

Someone searching “alcohol rehab near me” gets a Local Pack and no AI Overview. Someone searching “what is MAT treatment” gets an AI Overview that...

Google treats financial queries differently from every other vertical. The same system that writes confident overviews for recipes and travel applies stricter safety filters to...

The Department of Justice moved the first Title II compliance date to 26 April 2027, which leaves eight months for public entities serving 50,000 people...
Download the Full AI Intake Benchmark Study
Free download. No sales call required.